The RAG Reports section provides a high-level view of fire risk assessment findings and actions across one or more buildings. Reports are grouped using a Red, Amber, Green (RAG) severity rating, allowing users to quickly identify areas requiring attention and generate a detailed Excel report for further analysis.
Accessing RAG Reports
Go to the Management Dashboard.
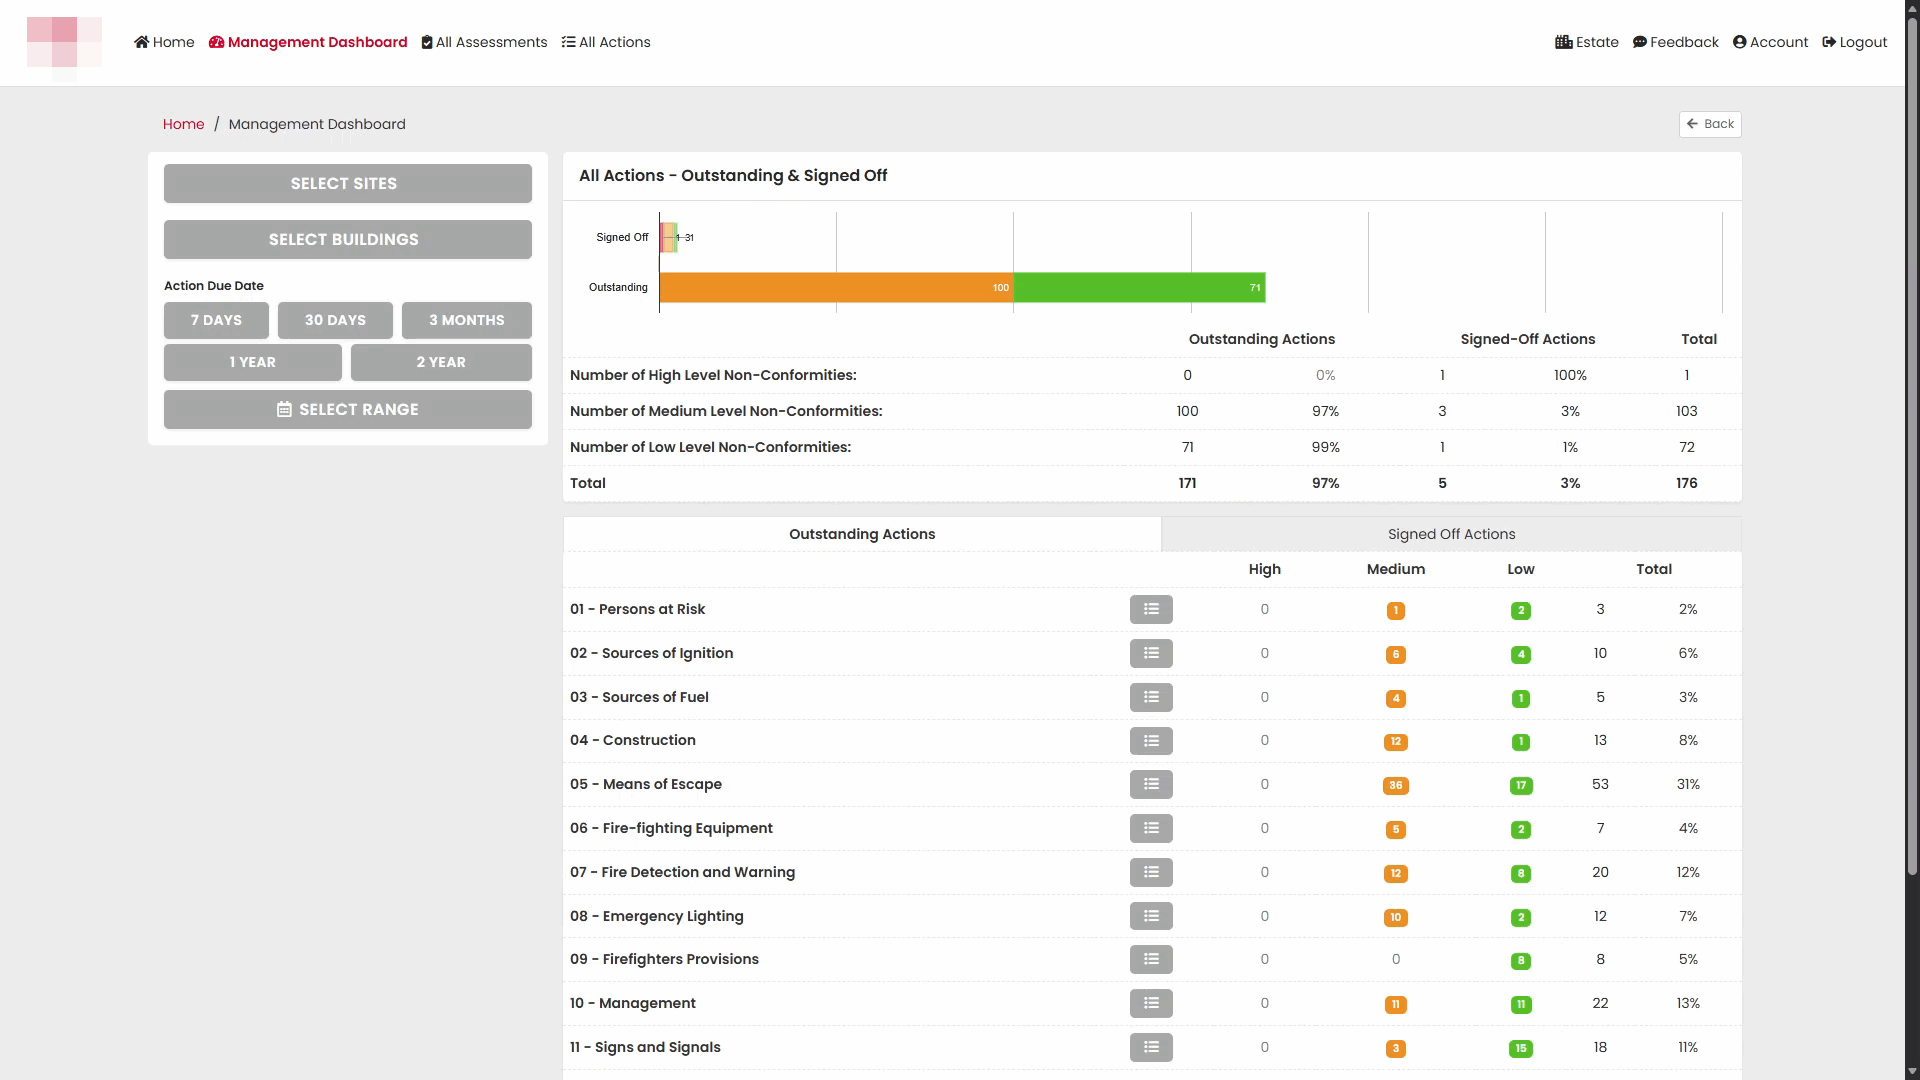
The page contains filters that allow you to select the buildings and date range to include in the report.
Filtering the Report
Before generating a report, choose the required criteria.
Available filters include:
- Site
- Building
- Action due date range
Use these filters to focus the report on specific locations or periods.
Understanding the Summary Statistics
After selecting your filters, the page displays summary information showing the number of actions and findings by severity level.
This section includes:
- Outstanding actions
- Signed-off actions
- Total actions
- High-level non-conformities
- Medium-level non-conformities
- Low-level non-conformities
These figures provide an overview of current fire safety compliance across the selected buildings.
Reviewing RAG Categories
The report groups findings into three severity levels:
| Severity | Meaning |
|---|---|
| Red | High priority issues requiring urgent attention |
| Amber | Medium priority issues requiring action |
| Green | Low priority items or observations |
The dashboard displays the number of Red, Amber and Green findings together with the number of actions that have been signed off.
Reviewing Results by Assessment Section
Further down the page, findings are grouped by fire risk assessment section.
Examples include:
- Persons at Risk
- Sources of Ignition
- Sources of Fuel
- Construction
- Means of Escape
- Fire-fighting Equipment
- Fire Detection and Warning
- Emergency Lighting
- Management
- Signs and Signals
For each section, the report displays the number of High, Medium and Low findings together with totals.
Generating a Status Report
To export the results, select Generate Status Report (Excel).
An Excel workbook is generated containing detailed information about the selected results.
Opening the Exported Report
Once the workbook has been downloaded, open the file in Microsoft Excel.
The workbook contains several worksheets that organise findings by severity level and status.
Summary Worksheet
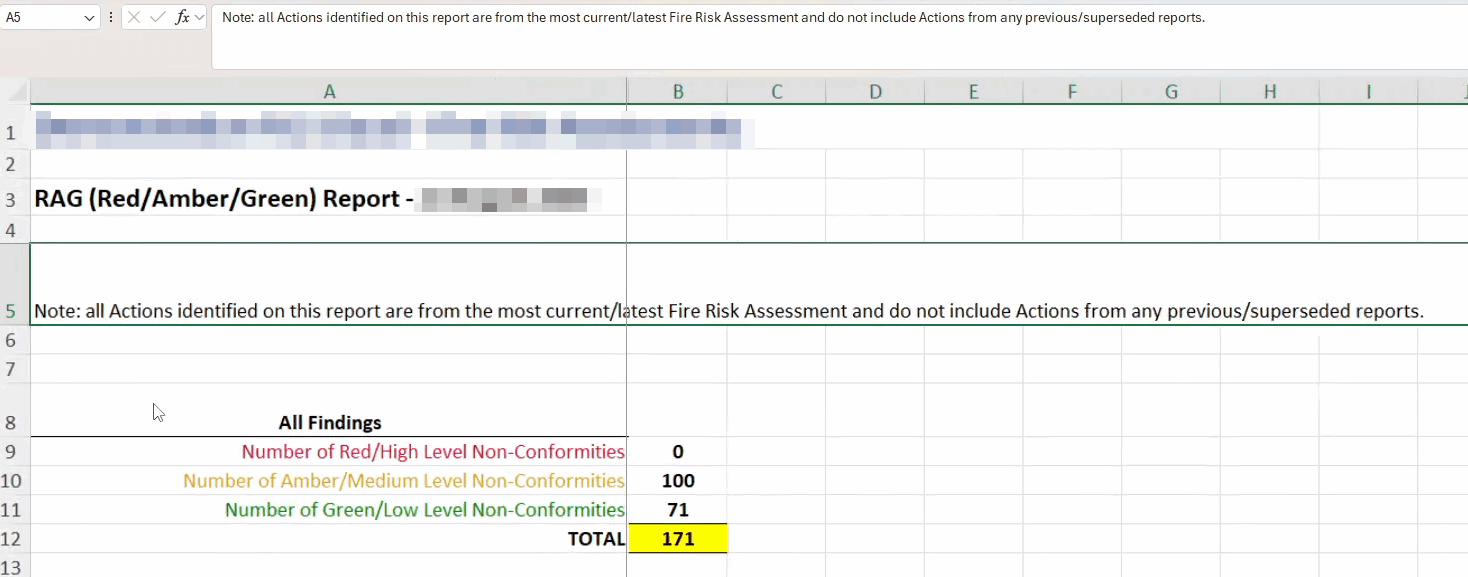
The first worksheet provides an overview of the exported results.
This worksheet mirrors the dashboard totals and presents a summary of:
- Outstanding actions
- Signed-off actions
- High findings
- Medium findings
- Low findings
Use this sheet to quickly review overall performance.
RAG Worksheet
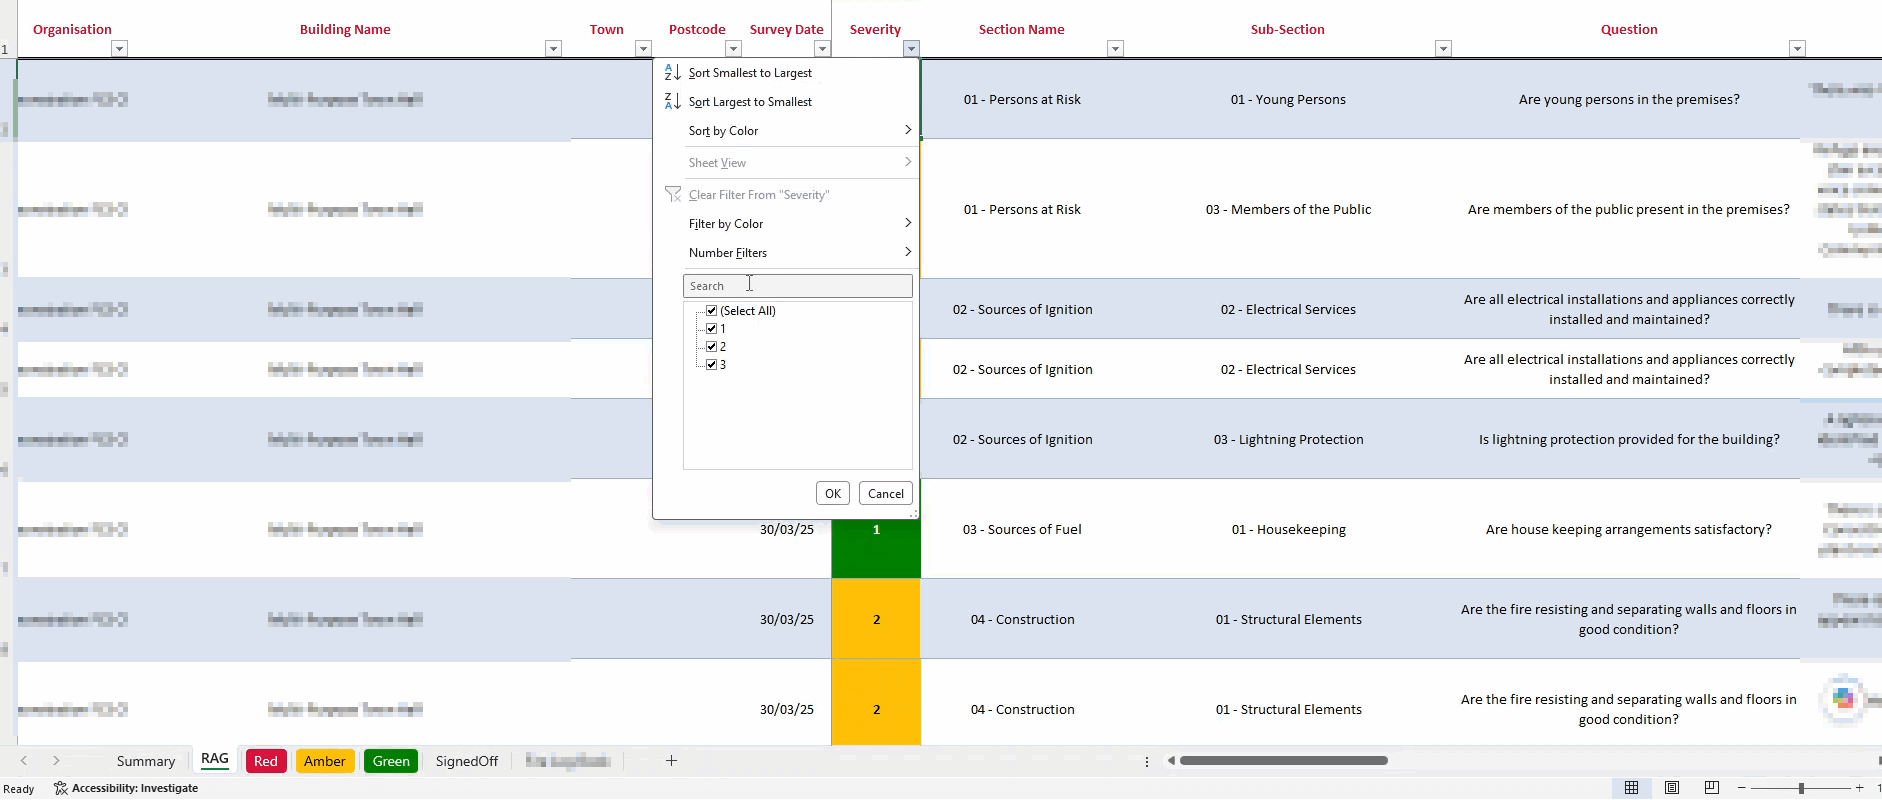
The RAG worksheet contains all findings included in the export.
Information available includes:
- Organisation
- Building name
- Town
- Postcode
- Survey date
- Severity
- Assessment section
- Sub-section
- Question
- Observation details
This worksheet provides the complete data set from the selected report.
Viewing Red Findings
To focus only on high-priority findings, open the Red worksheet.
The worksheet contains only findings with a Red severity rating.
Each record includes the assessment location, section, question and observation that generated the Red rating.
Viewing Amber Findings
To review medium-priority findings, open the Amber worksheet.
The worksheet lists all Amber-rated findings included in the report.
Use this information to identify issues that require attention but are not classified as urgent.
Viewing Green Findings
To review low-priority findings, open the Green worksheet.
This worksheet contains findings that have been assigned a Green rating.
Green findings can be reviewed as part of routine monitoring and continuous improvement activities.
Viewing Signed-Off Findings
The SignedOff worksheet shows findings where associated actions have been completed and signed off.
The worksheet provides the same level of detail as other severity worksheets while focusing only on completed actions.
This information can be used to demonstrate completed remedial work and track progress over time.
Understanding Severity Values
Within the worksheets, severity is represented numerically:
| Value | Severity |
|---|---|
| 3 | Red |
| 2 | Amber |
| 1 | Green |
This allows filtering and analysis within Excel using standard spreadsheet tools.
Closing the Report
After reviewing the information, close the workbook.
If prompted to save changes, choose the appropriate option depending on whether you have made amendments to the report.
You can then return to the Portal to continue working in the Management Dashboard.
Was this article helpful?
That’s Great!
Thank you for your feedback
Sorry! We couldn't be helpful
Thank you for your feedback
Feedback sent
We appreciate your effort and will try to fix the article